What are Core Web Vitals?
Core Web Vitals are a set of standardised metrics from Google that help developers understand how users experience a web page. While Core Web Vitals were created for developers, these tools can be used by all site owners because they break down the user’s real-world experience on a page.
Core Web Vitals identify user experience issues by generating a metric for three primary areas of user experience, including:
- Page loading performance
- Ease of interaction
- Visual stability of a page from a user’s perspective
A Page Performance Score is a single metric that considers all of the important user experience metrics in Core Web Vitals. This score uses an aggregate scoring system across all mobile and desktop visits. It takes the weighted average to deliver a single score to understand pages that need closer examination quickly.
We tested 70 dental websites from across the UK and have outlined the scores below.
Dental practice website “Performance”
Page performance is a really important metric for user experience. However, just over 65% of the 70 websites we tested rated “poor”, i.e below 50 out of 100, and an extra 28% needed improvements. This meant that overall 93% were either poor or needed improvement.
Dental practice website “Accessibility”
This is often overlooked. In the tests we ran, around 50% of sites either needed improvements or were poor.
What else might you find on reports from “Core Vitals”?
Performance ratings included things like:
- Next Gen Image Formats, such as Webp and AVIF
- Network payloads and any Render Blocking Resources in JS and CSS
Accessibility ratings included things like:
- Interactive Icons size and giving the Icons enough space as to not overlap
- Named buttons for any users needing to use Screen Readers
Best Practice ratings included things like:
- Using HTTPS
- Image’s natural dimensions being proportional to the display size and pixel ratio
SEO (Search Engine Optimisation) ratings included things like:
- Descriptive text for links
- Image alt attributes for informative elements
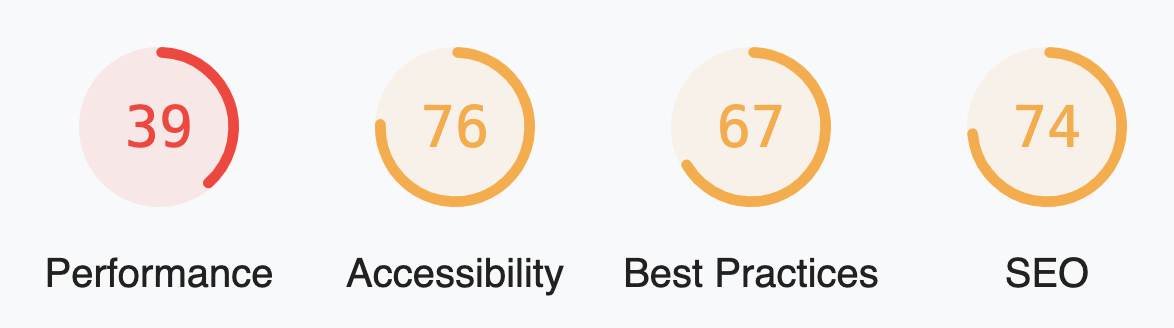
Example of Core Vitals Report
To run your own report, please visit https://web.dev/measure
If you would like to talk to us about how we can improve these, why not book an appointment today!
Key for the graph:
90+ (Good), 50–90 (Needs Improvement), and below 50 (Poor)
*please note some content is taken from https://moz.com/learn/seo/performance-metrics
Start optimising your website
Book your free 45min performance review
2/4 Slots available